

gis-laguerre#
Type: Open-source library + technical writing License: Apache 2.0 Repository: dai-mo/gis-laguerre Article: Towards Data Science, 2021
Overview#
gis-laguerre is a Python library implementing Laguerre-Voronoi diagrams (also known as weighted Voronoi or Power diagrams) for geospatial applications. It was developed to solve a concrete data preparation problem in the Solve for Good / WRI project, then packaged and documented for broader use.
The library bridges computational geometry and practical GIS workflows, integrating with GeoPandas to make weighted spatial partitioning accessible to data scientists working with heterogeneous geospatial datasets.
The Problem It Solves#
Many geospatial datasets consist of point observations — survey clusters, weather stations, monitoring sites — each representing a surrounding geographic area. A common challenge is: how do you assign spatial extent to each point, accounting for the fact that some points represent larger or more important regions than others?
Standard Voronoi diagrams give each point equal influence. Laguerre-Voronoi diagrams generalise this by allowing each site to carry a weight, so the resulting cells reflect the relative importance or representativeness of each point.
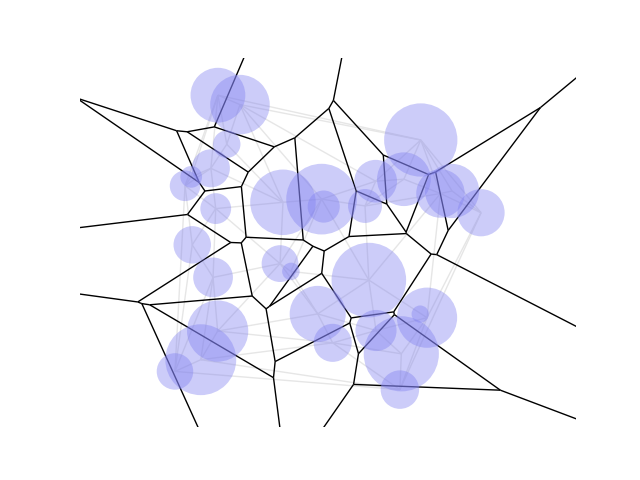
This is particularly useful when working with survey data such as the Demographic and Health Surveys (DHS), where clusters represent populations of different sizes across urban and rural areas, and where GPS coordinates carry a privacy offset (up to 5 km in rural areas, 2 km in urban areas).
Application: India DHS Data#
The library was applied to DHS cluster data across India, assigning spatial cells weighted by urban/rural classification and cluster sample size.
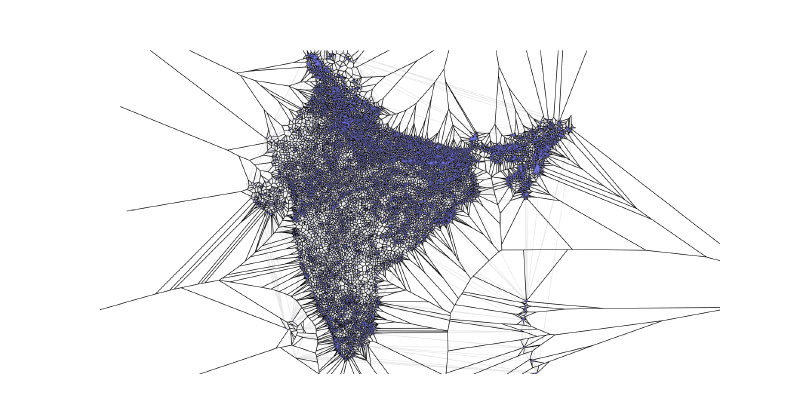
The tessellation creates a seamless spatial partition of the country, with each cell representing the geographic area of influence for a single survey cluster. This provides a principled spatial framework for joining DHS data with raster datasets (satellite imagery, night-time lights) and vector datasets (OpenStreetMap features).
Technical Details#
Core algorithm: Laguerre-Voronoi / Power Diagrams, based on an implementation by Alexandre Devert. The weighted diagram is computed from a set of sites with associated weights, producing cells where each point belongs to the site for which the power distance is minimised.
Stack:
- Python 3 with
pipenvenvironment management - GeoPandas and Shapely for spatial operations and geometry handling
- GADM administrative boundary data for clipping
- DHS survey data as the primary input dataset
Key inputs:
- DHS cluster coordinates and urban/rural classification
- GADM national/state boundary shapefiles
- Weights derived from cluster type (urban/rural) and sample size
Key outputs:
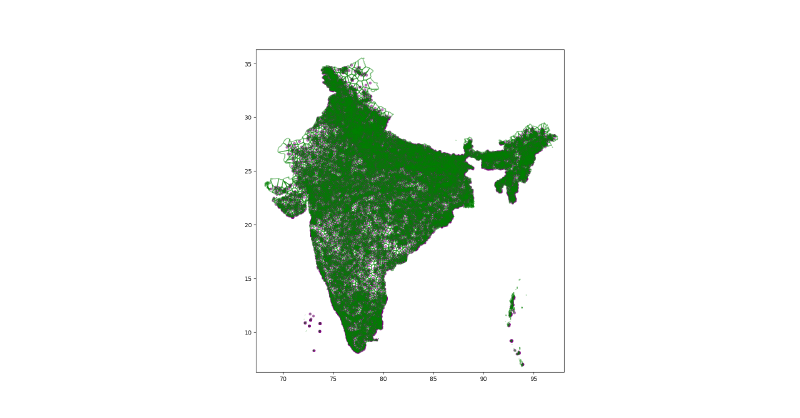
- GeoDataFrame of Voronoi polygons clipped to study area boundary
- Ready for spatial joins with OSM features, raster data, or any other geospatial layer
Towards Data Science Article#
The library is accompanied by a detailed technical article published on Towards Data Science, walking through:
- The motivation for weighted Voronoi over standard Voronoi
- How DHS privacy offsets affect spatial analysis and how Laguerre-Voronoi handles this
- Step-by-step Python implementation using
gis-laguerre - Visualisations of the tessellation applied to real survey data across India
Read: Data Preparation for Geospatial Analysis & ML with Laguerre-Voronoi in Python →
Related Work#
gis-laguerre was built as the spatial data preparation component of the Solve for Good / WRI project — a Data Science for Social Good fellowship collaboration with the World Resources Institute to predict socioeconomic well-being in India using satellite imagery and ML.
Domain: Computational geometry · Geospatial data science · Python open source
Acknowledgements: Solve for Good initiative · Gijs van den Dool · World Resources Institute · Alexandre Devert (Laguerre-Voronoi algorithm)