
Solve for Good × World Resources Institute#
Programme: Data Science for Social Good (DSSG) fellowship Partner: World Resources Institute (WRI) Repository: dssg/solveforgood-wri
The Challenge#
Traditional measures of economic well-being — census data, household surveys, wealth indices — are expensive to collect, infrequent, and often sparse in exactly the regions where they are most needed. In large parts of India, the most recent ground-truth data on wealth and living standards is years out of date.
Can satellite imagery, open map data, and machine learning substitute for costly in-person surveys?
This was the central question of the Solve for Good fellowship collaboration with the World Resources Institute. The goal: build a well-being data layer that predicts the wealth index of any given area in India using only freely available, continuously updated data sources.
Ground Truth: DHS Wealth Index#
The project used Demographic and Health Survey (DHS) data as ground truth. DHS clusters each have a wealth index scored on a 1–5 scale, derived from household-level indicators including:
- Access to electricity
- Toilet type (flush vs. pit)
- Water source
- Roofing material
- Household assets
A key challenge: DHS applies a GPS privacy offset to all cluster coordinates — up to 5 km in rural areas, 2 km in urban — making precise spatial matching with other data sources non-trivial.
Spatial Data Preparation: Laguerre-Voronoi#
To match DHS clusters with spatial features from OSM and satellite data, each cluster needed a defined geographic area of influence. Standard buffers or equal-area Voronoi cells ignore the fact that urban and rural clusters represent very different population densities.
The solution was Laguerre-Voronoi tessellation (weighted Voronoi / Power diagrams), implemented in the companion gis-laguerre open-source library. Each DHS cluster is assigned a cell weighted by its urban/rural classification, creating a spatial partition that reflects representativeness.
Feature Engineering#
Three data streams were aggregated per Voronoi cell:
OpenStreetMap (OSM)
Extracted via OSMnx: amenities, buildings, highways, and tagged infrastructure features. OSM encodes observable proxies of economic activity — density of roads, hospitals, markets, and services all correlate with local wealth.
Night-Time Light (NTL) Satellite Data
- NASA VIIRS/NPP LunarBRDF-Adjusted Night-Time Light data at 500 m resolution
- Google Earth Engine monthly composites
- Averaged per Voronoi cell as a continuous proxy for electrification and economic activity
DHS Indicators Exploratory analysis revealed strong correlations between wealth and:
- Electricity access
- Flush toilet prevalence
- Urban/rural classification
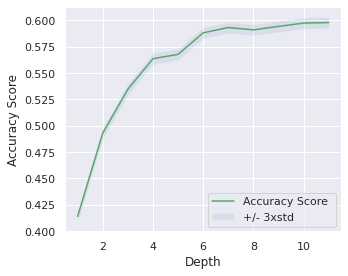
Model & Evaluation#
Problem formulation: Regression — predict a standardised wealth score [0–1] per cluster from OSM + NTL features.
Model: Decision tree, chosen for interpretability and explainability — essential for a social impact context where stakeholders need to understand and trust predictions.
Evaluation: Leave-One-Out Cross-Validation (LOOCV), which is appropriate for small, spatially structured datasets where standard random splits can introduce optimistic bias.
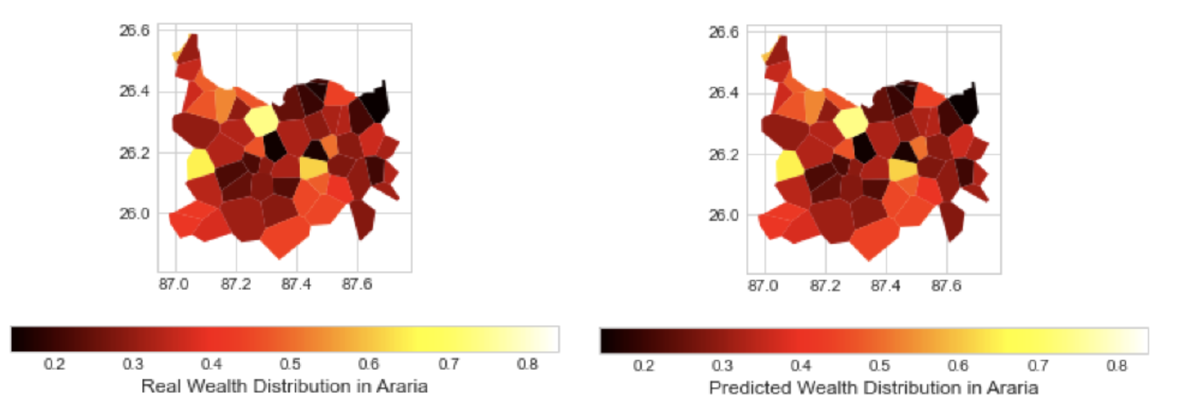
Predictions vs. Ground Truth#
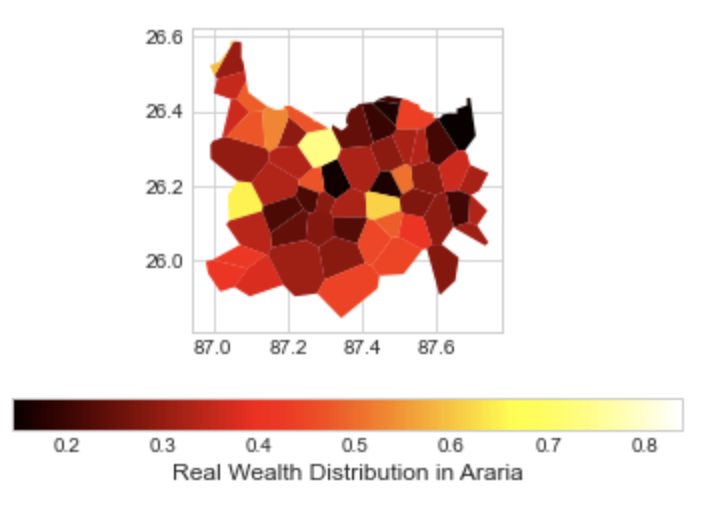 | 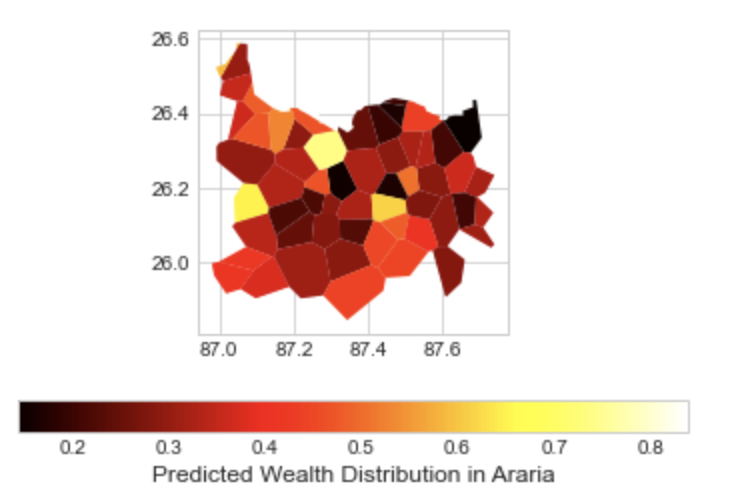 |
| Actual wealth index | Predicted wealth scores |
Spatial analysis of the Araria district in Bihar, India — a focus region chosen for its data availability — revealed localised wealth variation within districts, with prediction errors primarily in the 0.1–0.2 range.
Key Findings#
- Wealth correlates most strongly with electricity access and flush toilet use in the DHS data
- OSM feature density provides meaningful signal, though data completeness varies geographically
- Night-time light data is a consistent proxy for economic activity at the cluster level
- Preliminary results showed the model can learn to differentiate wealth levels, providing evidence that higher-quality features would yield a deployable system
Impact & Scope#
A reliable well-being prediction layer would enable:
- Policy targeting — directing interventions to underserved areas without waiting for the next survey cycle
- Impact monitoring — tracking changes in well-being over time using continuously updated satellite data
- Coverage extension — scaling predictions beyond India to any region where DHS data exists
The project was scoped with deployment across India and eventual extension to other countries.
Related Work#
The spatial data preparation methodology was packaged into the open-source gis-laguerre library and documented in a Towards Data Science article, making the Laguerre-Voronoi approach available to the wider data science community.
Domain: Applied ML · Social impact · Geospatial data science · Satellite imagery · Economic development
Data: DHS (Demographic and Health Surveys) · OpenStreetMap · NASA VIIRS Night-Time Light
Stack: Python · GeoPandas · OSMnx · Google Earth Engine · scikit-learn